
Below, find the 10 most common ways to use Desmos on SAT Tests: once you have a good understanding of how to use Desmos the SAT quickly becomes much easier!
1. Solving Single Variable Equations
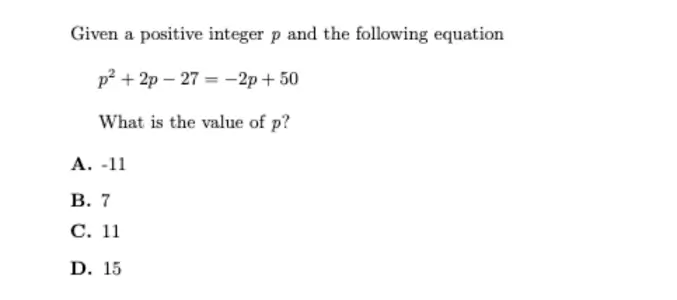
Desmos likes x and y as variables (and a,b,c, etc as parameters / sliders):
- Type x^2 + 2x -27 = -2x + 50.
- Scroll out on your graph if you don’t see anything right away. You should see vertical lines. The x-values of the vertical lines are the solutions to the equation.

2. Evaluate f(x) at x=?
Example1:
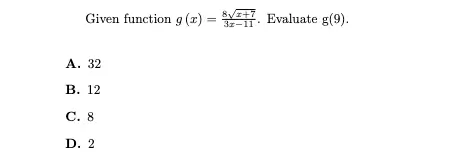
Desmos steps:
- In line 1, type g(x) = 8sqrt(x+7) / (3x-11).
- In line 2, type g(9).
- The answer will be displayed in the lower right corner of line 2.
Example 2: You do it !

3. Number of Solutions
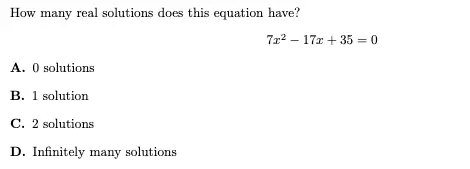
Desmos steps:
- In line 1, type f(x) = 7x^2 – 17x + 35 (the left side of the equation)
- Count how many x-intersect.

4. Solving Systems of Equations
This is one of the best uses of Desmos.
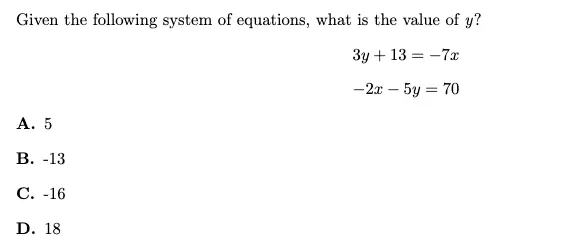
Desmos Steps:
- In line 1, type 3y + 13 = -7x.
- In line 2, type -2x – 5y = 70.
- The answer will be the point where these two graphs intersect. The point should be automatically highlighted by Desmos. Here, it wants the y-value of that point.

5. Solving Systems of Inequalities
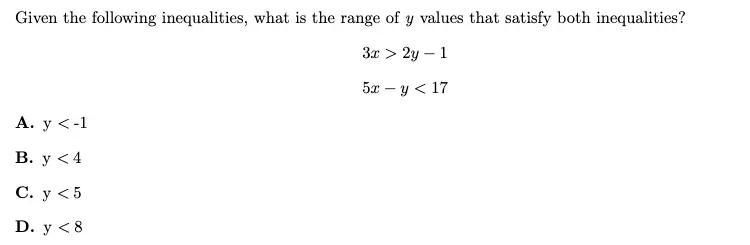
Desmos steps:
- In line 1, type 3x > 2y – 1.
- In line 2, type 5x – y < 17.
- In the graph, find the lowest point where the two shaded areas overlap. The answer will be y < # where the number is the y-value of that point (or greater than, if going in the other direction).
6. Finding the Equation of a Line from Points
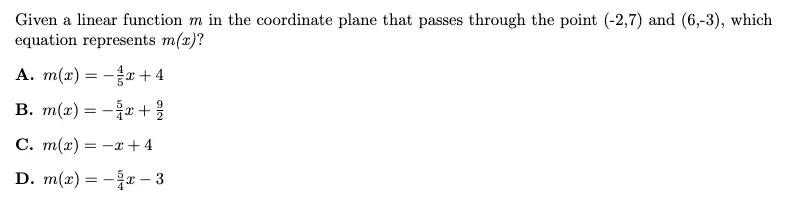
Desmos steps:
- In line 1, type table. A table will pop up.

- In the x1 column, type your x-values from your points. In the y1 column, type the corresponding y-values.
- Under the line number (under the 1 on the left), hit the symbol the looks like a diagonal line between 4 dots.
- Your answer is under EQUATION.

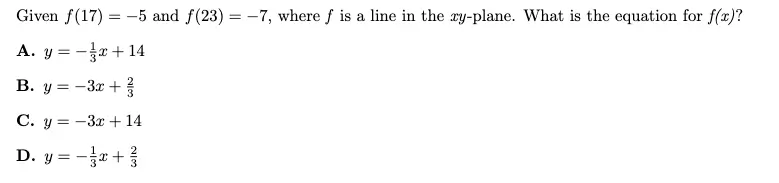
Another version of this problem for you to try:
7. Finding the Equation of a Non-Linear Function given x/y coordinates of points
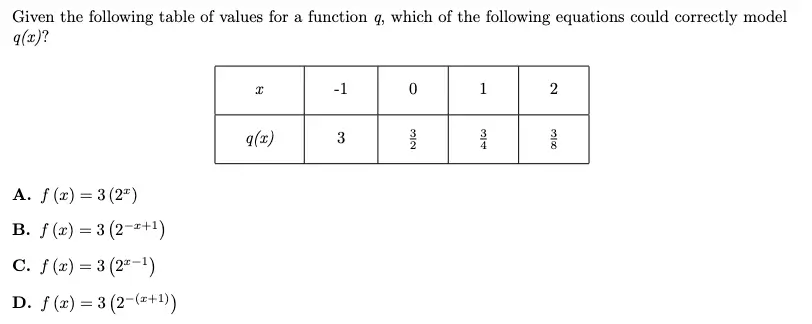
Desmos steps:
- In line 1, type table. A table will pop up.
- In the x1 column, type your x-values from your points. In the y1 column, type the corresponding y-values.
- Under the line number (under the 1 on the left), hit the symbol that looks like a diagonal line between 4 dots.
- Click the dropdown which says Linear Equation and select from the menu the type of equation you are trying to model. Here that would be Exponential Regression. You may also need to use the Quadratic or Cubic Regressions on the SAT.
- Your answer is under EQUATION.
8. Finding an X or Y-Intercept from an Equation

Desmos steps:
- In line 1, type in 7x/5 – 18 = 3y/4.
- If you hover over your line, Desmos will highlight the y-intercept (and x-intercept(s)) automatically. The answer is the y-value of that point.
9. Finding the Vertex (Minimum or Maximum) of an Equation

Desmos steps:
- In line 1, type in f(x) = -x^2 – 40x – 176.
- If you hover over your line, Desmos will highlight the maximum (or minimum) point automatically. The answer is the y-value of that point.
10. Transformation of a Function

Desmos steps:
- In line 1, type h(x) = x/2(x – 5)^2(x + 4).
- In line 2, type h(5 – 2x). This will give you a transformed graph of the original function. The value of g(x) is 0 at its x-intercepts, which will be marked automatically. You could also type another equation f(x) = {insert what you need g(x) to equal} and look at the intersection points.
Note: Desmos will handle all the standard transformations. Try typing 7h(x), -g(h + 7), and h(2x) – 8. It will do them all.
11. Finding a Point on a Circle
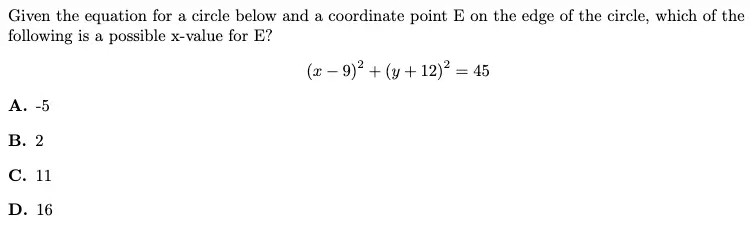
Desmos steps:
- In line 1, type (x – 9)^2 + (y + 12)^2 = 45.
- Your answer choices are x-values. Only one of them will match up with the x-values of the points on the circle.
Example2: Try it for yourself.

12. Finding Median and Mean of a List of Numbers

Desmos steps:
- In line 1, type mean( ). For median, type median( ).
- Put your list of numbers in the parentheses, separated by commas. Mean (13, 15, 25, 26, 29, 29, 34, 37). The answer will show up instantly.
13 Find Greatest Common Divisors

14 Inequalities

To find the common solution region for two or more inequalities, input them together into Desmos. For example, plotting 𝑦 > 2 𝑥 + 1 and 𝑦 < − 𝑥 + 4 will display overlapping shaded regions.
Shade solution regions for inequalities to visually verify answers for SAT problems involving ranges or constraints.
15 Midpoints and Distance

16 Percents and Quick Arithmetic

- Use Desmos’ calculator feature for quick percent calculations or to perform operations like addition, subtraction, and multiplication.
- For routine calculations, Desmos can often be faster than a handheld calculator since it eliminates the need to switch devices or navigate physical buttons. You can simply type directly into Desmos.
17 Domain and Range

Problems when Desmos could help but may take too long
Generally, I advise that you avoid using Desmos for these if you can solve them traditionally, but Desmos will work in a pinch. Desmos can also be the best strategy for some of these if the problems are multiple-choice.
1. Equivalent Expressions
You can use Desmos to solve these, but it is very slow since you cannot copy and paste the equations. I recommend you only use Desmos if you cannot solve it by hand.
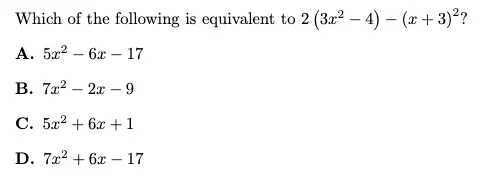
Desmos steps:
- In line 1, type table. A table will pop up.
- In the header row, type x in the first box, 2(3x^2 – 4) – (x + 3)^2 in the second box, and each of your answers in the next 4 boxes.
- Type a bunch of random x-values (numbers) in the first column. The answer choice with answers that match the ones is the second column will be the answer.

2. Intersecting with a Quadratic at 1 Point
You can do this problem with Desmos, but it is finicky. In general, if it is free response and you know how to do it by using the discriminant, I would do that. If it is multiple choice or you can’t remember how to do the traditional method, then maybe use Desmos.

Desmos steps:
- In line 1, type f(x) = 2x – 5/2.
- In line 2, type g(x) = x^2 + 8x + a. (For constants, I typically stick to a and b in Desmos. For variables, I usually stick to x and y.)
- You should see an option pop up to add a slider for a. Click the blue box to do that.
- Slide the slider back and forth until you can get the lines to only meet at one point. If you need to extend the range of the slider (default is -10 to 10), you can click on the numbers at the end of the range to type your own custom values. If you are working on a multiple-choice question, you can click on the number after a = to input each of your answer choices.
- Once you get them to line up at one point, that value of a is the answer.
3. Intersecting with a Quadratic at 0 Points

This problem is almost, but not quite, a classic intersection problem. It is effectively asking what values of d make g(x) = 3x^2 − 24x + d and h(x) = 0 not intersect. Like the previous problem type, I would generally use the discriminant rule instead if it is a free response question, but it can be done in Desmos. If it is a multiple-choice problem, Desmos is a fine option.
Desmos steps:
- In line 1, type g(x) = 3x^2 – 24x + a.
- In line 2, type h(x) = 0.
- Add a slider for a by clicking the box in the line 1.
- Start typing in values for c until you get the two lines to intersect at 1 point. Beyond that value for a they will not intersect, so that will be your answer. If it is multiple-choice, then the value for a which gives no solutions is the one where the lines do not intersect at all.
Problems You Should NOT Use Desmos to Solve
There are also several problems that are related to Desmos-able problem types that you should avoid solving with Desmos.
Problems to Avoid
- Difficult Mean & Median Problems
- Finding Center or Radius of a Circle
Here’s an example so you can see how to identify these problems.
Example of System of Linear Equations with a Constant

Typo: p is a in the problem. This problem looks like the other systems of equations problems where we definitely want to use Desmos, but it is not. You can tell this is a linear system of equations because the x in both equations is only to the power of 1 (x1). If you see this, you need to solve for the slopes of these equations and set them equal to each other because these equations are parallel lines. Do NOT use Demos with constant slider for this. It is too inaccurate.
DESMOS USE FOR:
- Solve Equations , 2×2 System of Equations, Quadratics
- Solve System of Equations with infinite or no solution
- Solve Inequalities
- Use x and y , a and b for sliders
- Given f(x) and analyze f(x+h) or a*f(x)
- Use Sliders for a,b,c and drag (quadratics , parallel for linear)
- Find Mean(1,2,3) , median(2,3,4)
- Use Tables
- Solve i.e. p(n)=2x^3 equals 16
- Graph Circles with known Center and Radius
- Factor / Expand yourself (Desmos takes too long but works)
- gcd
- Tilde + regression : y1 ~ m*x1 + b
More Practice below
Ready to take on the challenge? Dive into this carefully curated 20-question challenge and put your Desmos skills to the test. Each problem comes with an integrated Desmos calculator to help you explore, solve, and analyze as you go. While there’s no strict time limit, pushing yourself to complete it within 45 minutes can make the practice more realistic and test-like. So, how many can you get right? Use the score calculator at the end to predict your SAT score and track your progress. Let’s get started—your SAT success begins now!
Question 1.

Solution 1.
- Open Desmos and type the equation directly: x = 70 / (x + 3).
- Observe where the graph intersects the x-axis.
- Identify the negative x-intercept, which is −10.
Question 2.

Solution 2.
- Input the function: f(x) = 27 * (2/3)^x.
- Look where the graph intersects the y-axis (x=0).
- The y-intercept is (0,27).
Question 3.

Solution 3.
- Input the formula: 104 = 1/2 (x – 3) x.
- Observe the two solutions where the graph intersects the x-axis.
- Select the positive solution since x represents a length B. 16.
Question 4.


Solution 4.
- Enter the points into a table in Desmos.
- Use the regression feature: y1 ~ a * b^x1.
- Desmos calculates the equation C. y = 740⋅ (1+ 0.005) ^x
Question 5.
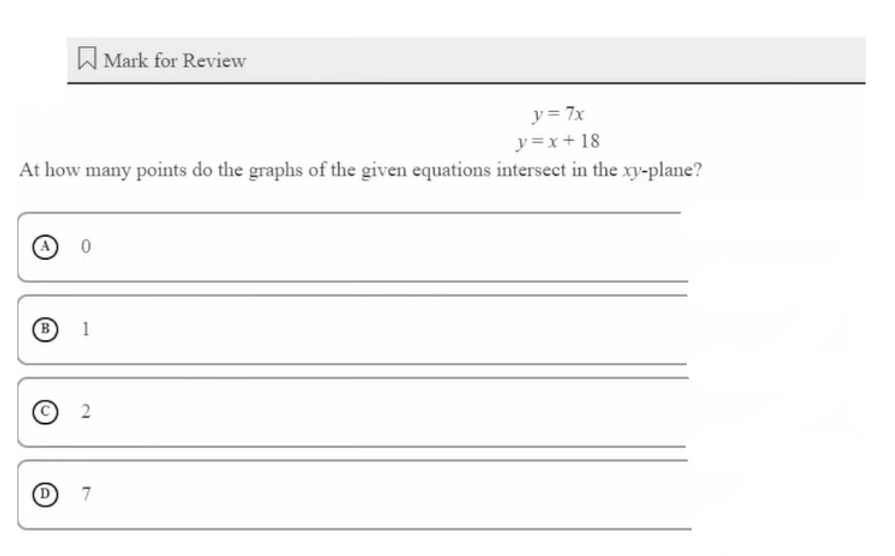
Solution 5.
- Enter both equations: y = 7x and y = x + 18.
- Identify the intersection point visually.
- The lines intersect at one point.B. 1
Question 6.

Solution 6.
- Enter both equations into Desmos.
- Observe the intersection point.
- The x-coordinate of the intersection is the solution. A. -6
Question 7.

Solution 7.
- Enter the function: f(x) = 12x^2 – 30x – 162.
- Click on the vertex (minimum point).
- The x-coordinate of the vertex is the answer.1.25
Question 8.


Solution 8.
- Enter y=7x+5y and the point (0,0) in Desmos.
- Add (4,n) with a slider for n.
- Adjust n until the slope of the line through the two points matches 7. 28
Question 9.

Solution 9.
- Enter the parabola and the line 𝑦 = 𝑃 with a slider for 𝑃
- Adjust 𝑃 until the line intersects the parabola at exactly one point.-9.8
Question 10.

Solution 10.
- Use median (21, 23, 24, 25, 26, 28, 32, 34, 37) in Desmos.
- The output gives the median 26
Question 11.

Solution 11.
- Enter both expressions as functions in Desmos.
- Adjust 𝑟 until the graphs overlap completely.
- The value of 𝑟 is A. 8
Question 12.

Solution 12.
- Enter g(x)=6+x^3.
- Evaluate g(3) directly in Desmos.
- The result is 33.
Question 13.

Solution 13.
- Enter h(t)=−16t^2+96t+100.
- Restrict t≥0 to focus on relevant values.
- Observe the y-intercept (t=0), which is D. 100.
Question 14.

Solution 14.
- Enter g(x)=x^2−4
- Create a table and input the x-values.
- Observe corresponding g(x) values.
- B. x | 0 | 2 | 4 g(x) | -4 | 0 | 12
Question 15.

Solution 15.
- Enter the formula: 2π=1/3 π 1^2 h.
- Solve for h using sliders in Desmos.
- The height is 6.
Question 16.

Solution 16.
- Graph both equations: 𝑦 = 3 ( 6 𝑥 + 11 ) and 𝑦 = 𝐷 ( 9 𝑥 + 4 ).
- Adjust 𝐷 until the lines are parallel.𝐷 = 2
Question 17.

Solution 17.
- Enter both inequalities.
- Find the overlap region and test points.
- The point that satisfies both is A. (8,4)
Question 18.


Solution 18.
- Enter the list as a = [3, 5, 5, 8, 9, 12, b].
- Add a slider for b.
- Adjust b until mean(a) equals median(a).
Question 19.

Solution 19.
- Enter S=1642⋅3^(nt).
- Set t=0.5 and adjust n until S is three times the initial value. C. 2
Question 20.

Solution 20.
- Enter both equations into Desmos:
- x+y=80
- y=2x+8
- Identify the intersection point of the two lines on the graph.
- The y-coordinate of the intersection point is56